CareLink Personal
What is the CareLink Dashboard?
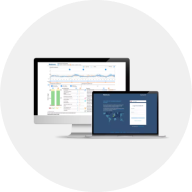
The CareLink Dashboard view helps simplify visualisation of your device data with access to key metrics over a single day, or 7, 14 or 30 day averages.
- Scroll and tap / click on the sensor glucose graph to view your sensor value in 5 minute intervals
- View Time in Range (with comparison periods when selecting 7,14 or 30 day view)
- Key metric tiles provide further information of your sensor / blood glucose, Total Daily Dose and sensor wear / infusion set information.
Note: Information displayed may differ depending on the device uploaded. Additional metrics will show for MiniMed™ Go system users.